> _
E-commerce marketing analytics — cross-channel performance monitoring
The challenge stemmed from marketing data being fragmented across ad platforms, analytics tools, and CRM systems. Manual exports and spreadsheet reporting slowed analysis. It introduced errors and delayed decisions.
As budgets grew, these gaps highlighted the need for business dashboard development focused on real-time, unified analytics.
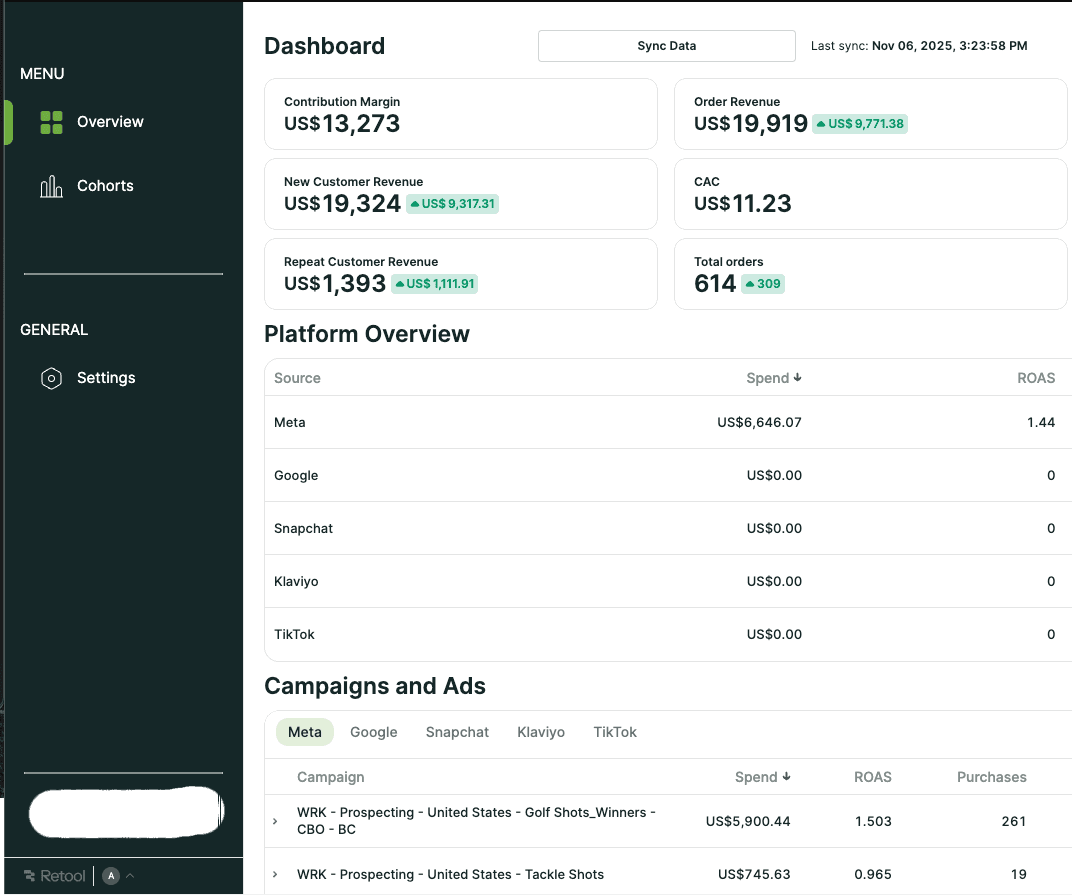
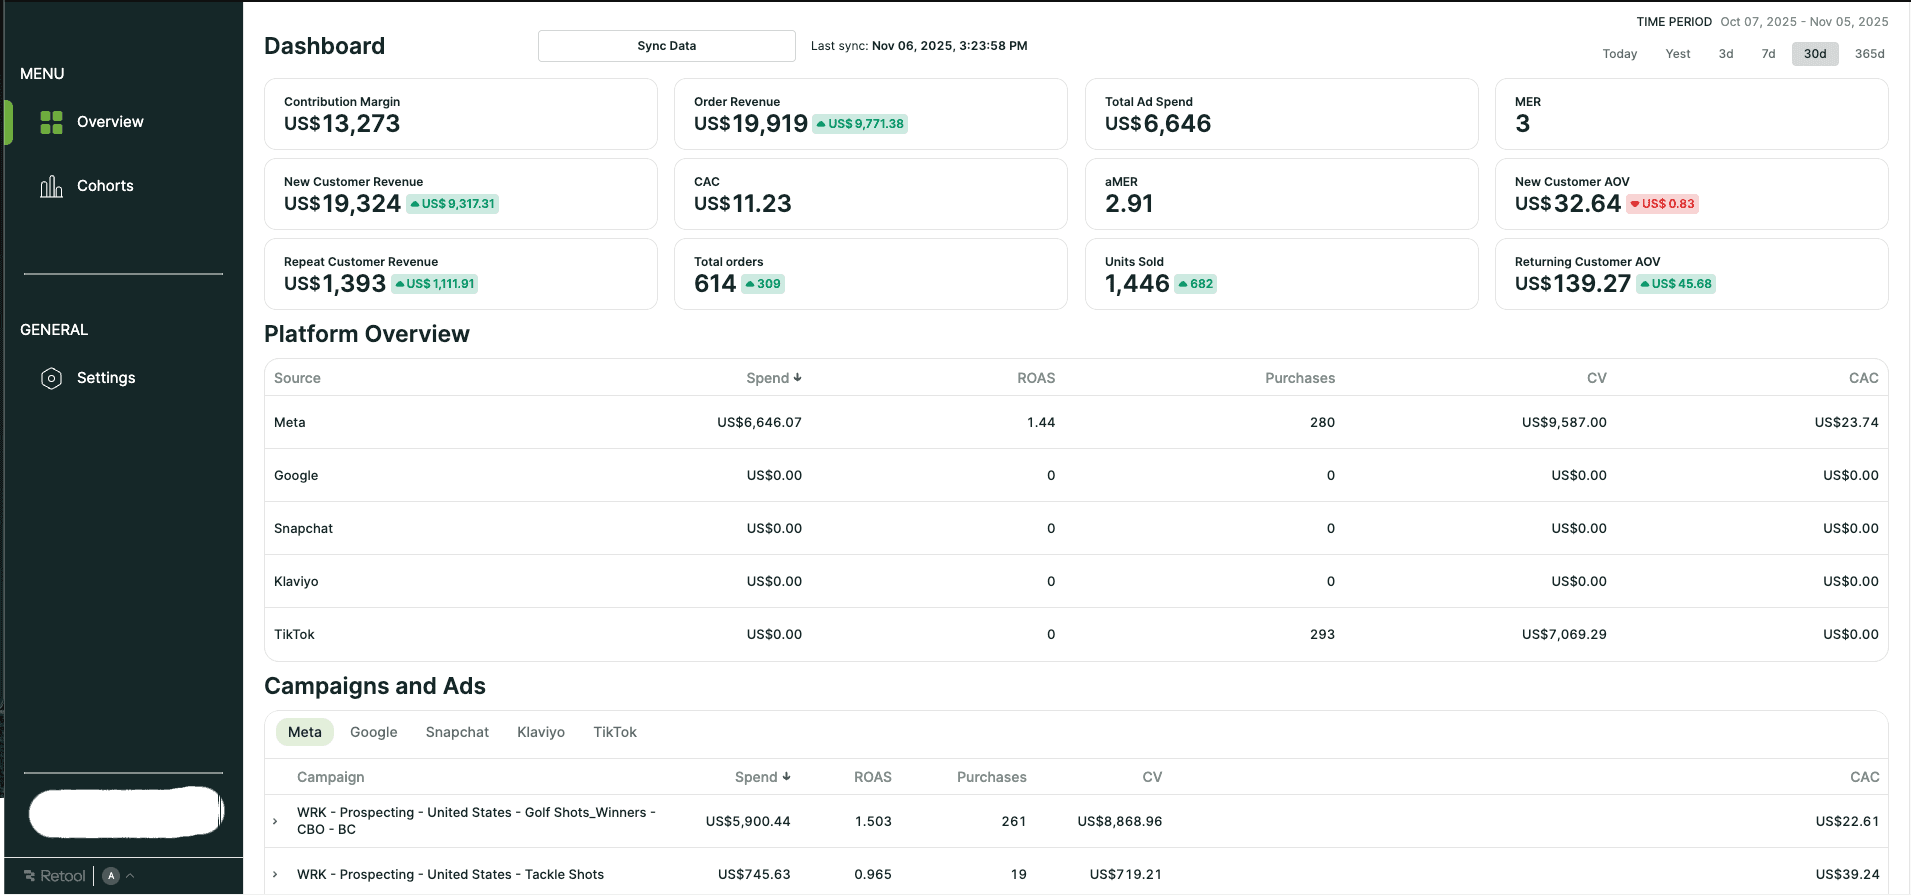
Our team focused on developing KPI dashboard with a unified Retool-based analytics application that automatically aggregates metrics from all major marketing channels into a single interface.
The platform replaces manual reporting with interactive dashboards. Those include live filters and scenario modeling tools. Delivered as a dashboard development initiative, the solution provides immediate visibility into campaign effectiveness. It supports data-driven budget decisions without relying on Excel or external analysts.
Retool, Google Ads API, Meta Ads API, GA4, Shopify API, Klaviyo/Mailchimp API, REST API, SQL, JavaScript inside Retool
Analytic Dashboard Development Overview
The project was built as a centralized analytics workspace designed specifically for marketing teams in e-commerce. Instead of switching between platforms, users access all core KPIs through a single interface.
As part of structured dashboard software development, the system delivers live metrics for spend, revenue, ROAS, conversion rate, and email performance. This approach ensures teams work with current data rather than delayed exports.
Custom Development Marketing Context
Modern marketing stacks generate large volumes of data across paid ads, email, on-site behavior, and CRM events. Without consolidation, teams lose visibility into how channels interact and impact sales.
Krasty Soft addressed the challenge through custom development for marketing, designing a platform that reflects real campaign workflows. The dashboard aligns marketing metrics with revenue outcomes, enabling faster evaluation of performance and channel efficiency.
KPI Dashboard Development Logic
The system was designed as a practical example of developing KPI dashboard architecture, with clear separation between overview metrics and deep-dive analysis. Key sections include:
- Dashboard overview. High-level KPIs, trend charts, and dynamic filters.
- Channel breakdown. Detailed comparison of Google, Meta, and email performance.
- Attribution view. Comparison of attribution models and channel influence on orders.
- Trends & correlations. Visual analysis of spend versus revenue and traffic behavior.
- Forecasts & scenario modeling. Simulations showing how budget changes affect ROI.
Low Code for Marketing Interface Flexibility
KPI business dashboard development was based on Retool to enable rapid iteration and easy customization. A low code for marketing approach allowed quick updates to charts, filters, and data sources without rewriting core logic.
Using low code for marketing, teams can adapt the dashboard as campaigns evolve while keeping data pipelines stable and reliable.
Outcomes and Impact
Dashboard development allowed our client to replace manual reporting with a real-time analytical workflow. Marketing teams gained faster insights and reduced operational overhead.
Key outcomes include:
- centralized access to all marketing and revenue metrics;
- faster campaign evaluation and optimization cycles;
- reduced reliance on spreadsheets and manual exports;
- clearer understanding of channel impact on sales;
- scalable analytics enabled by low code for marketing and modern API integrations.
This case demonstrates how custom development for marketing can transform fragmented marketing data into a reliable decision-making tool for e-commerce growth.